Client: Rise Interactive Year: 2023-2024 Role: UX Research, Wireframing, Prototyping, UI Design Team: Product Manger: Charlie Rock; Product Director: Andrew Boylan; Data Engineering Manager: Manoj Immadi
Background: Connex is Rise’s award-winning media optimization platform that allows our clients to manage their media cross-channel at scale. This level of performance transparency allows marketers to make client recommendations that many others can’t. Connex shows marketing budget performance at a high and granular level, to help marketers make the best decisions to improve a client’s ROI.
Problem
My team’s focus was specifically on Real-Time Pacing component of Connex, a page in which we update live to showcase how much budget spend has taken place over a certain period of time (1000s of flights can be shown at once).
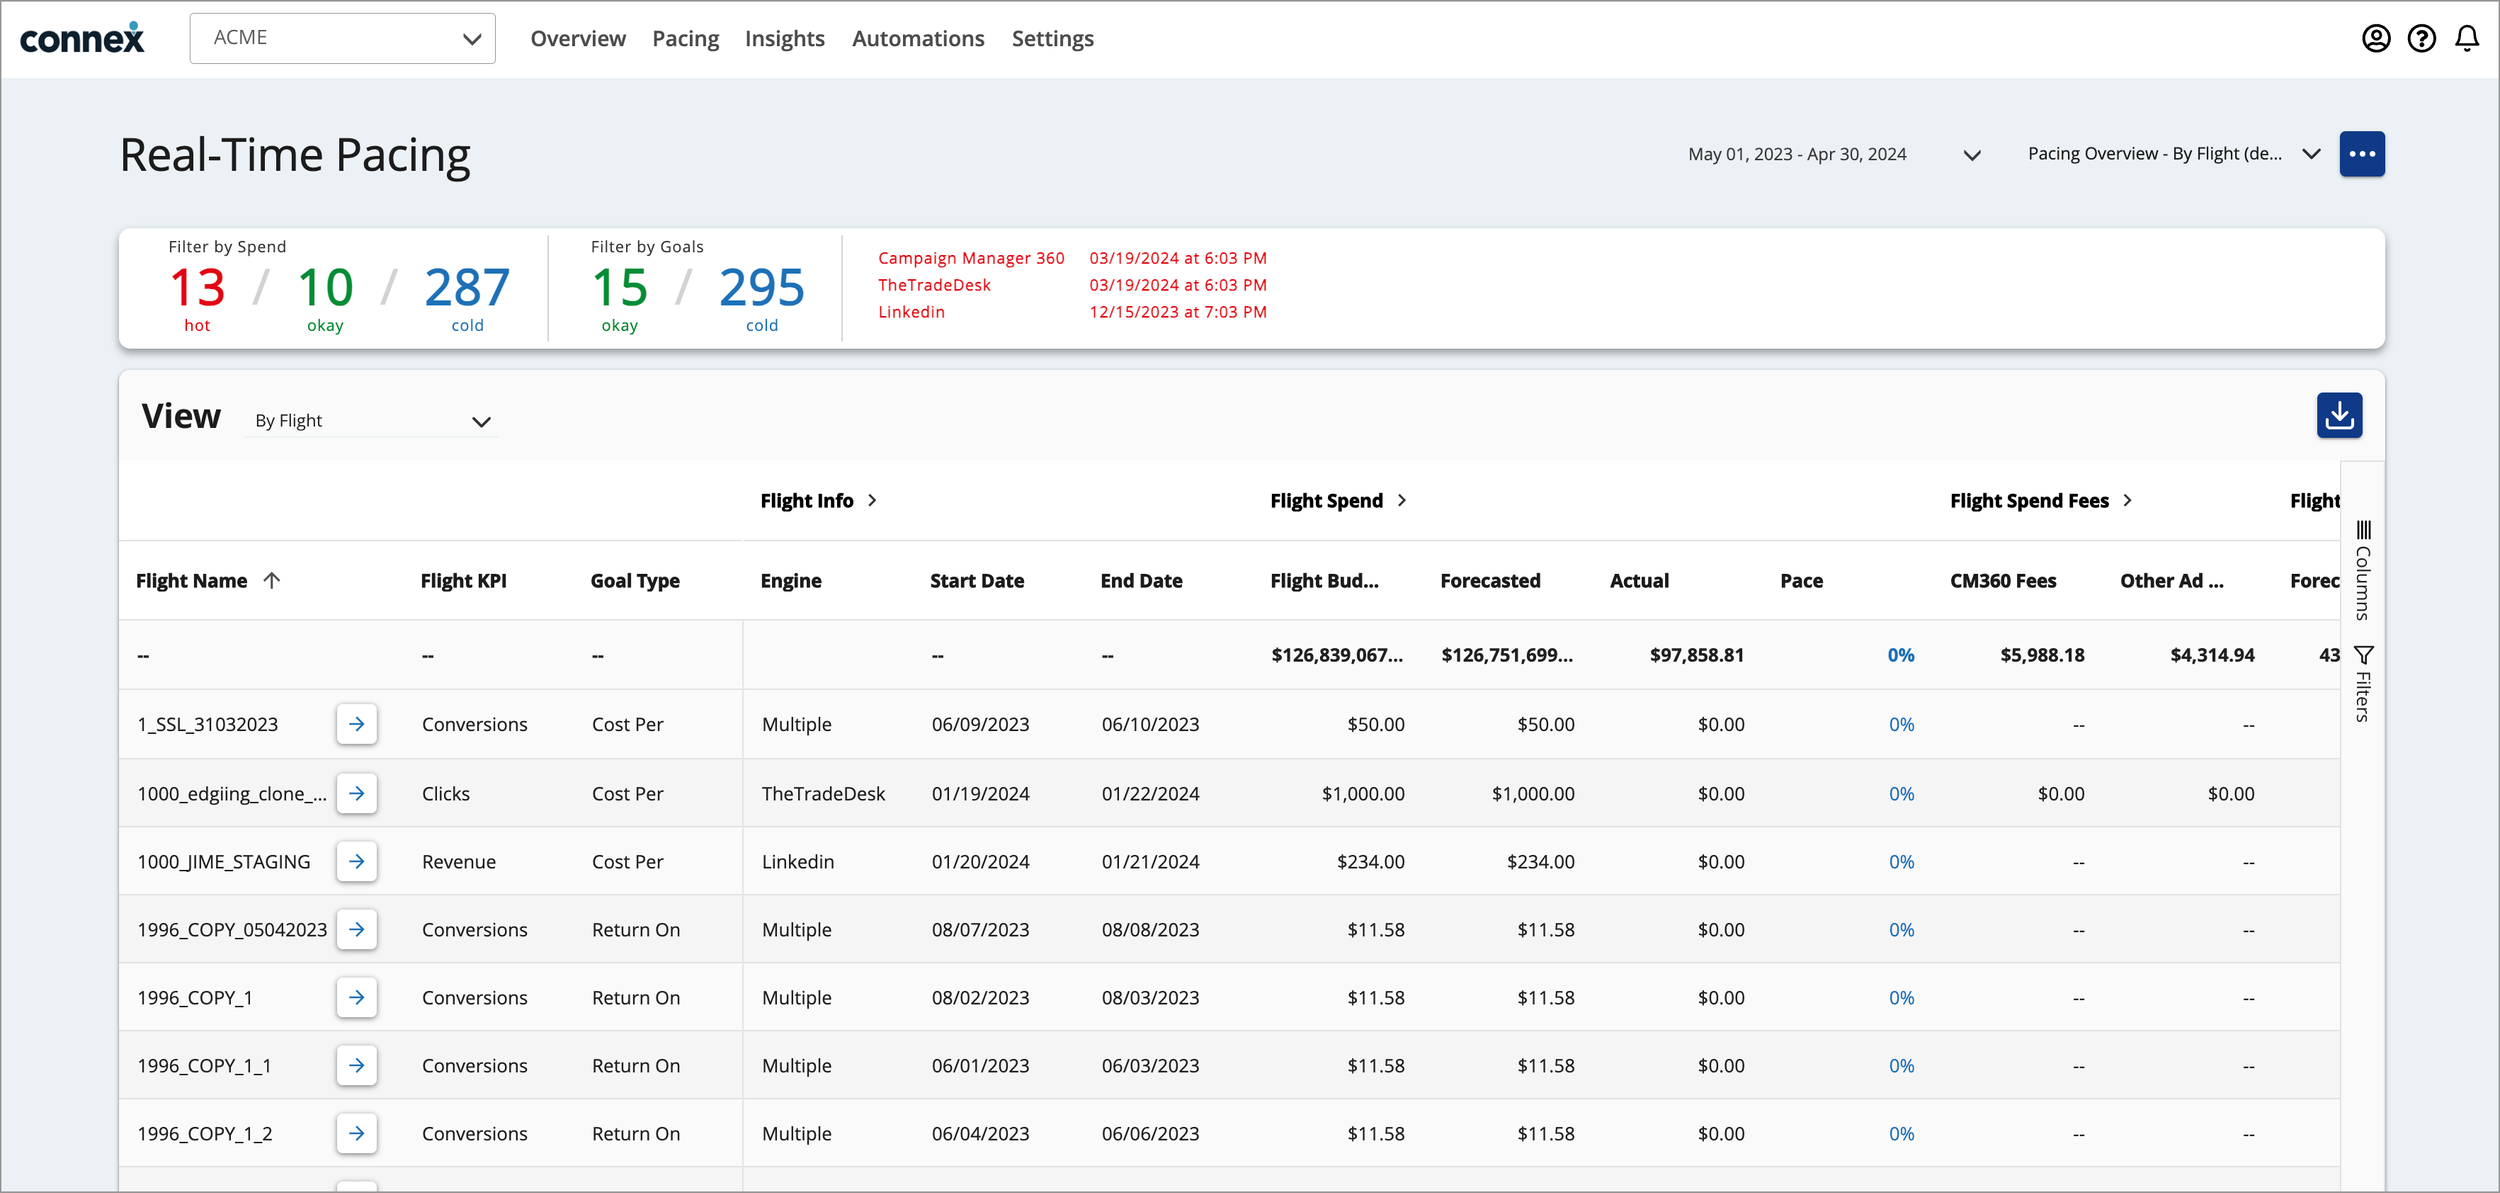
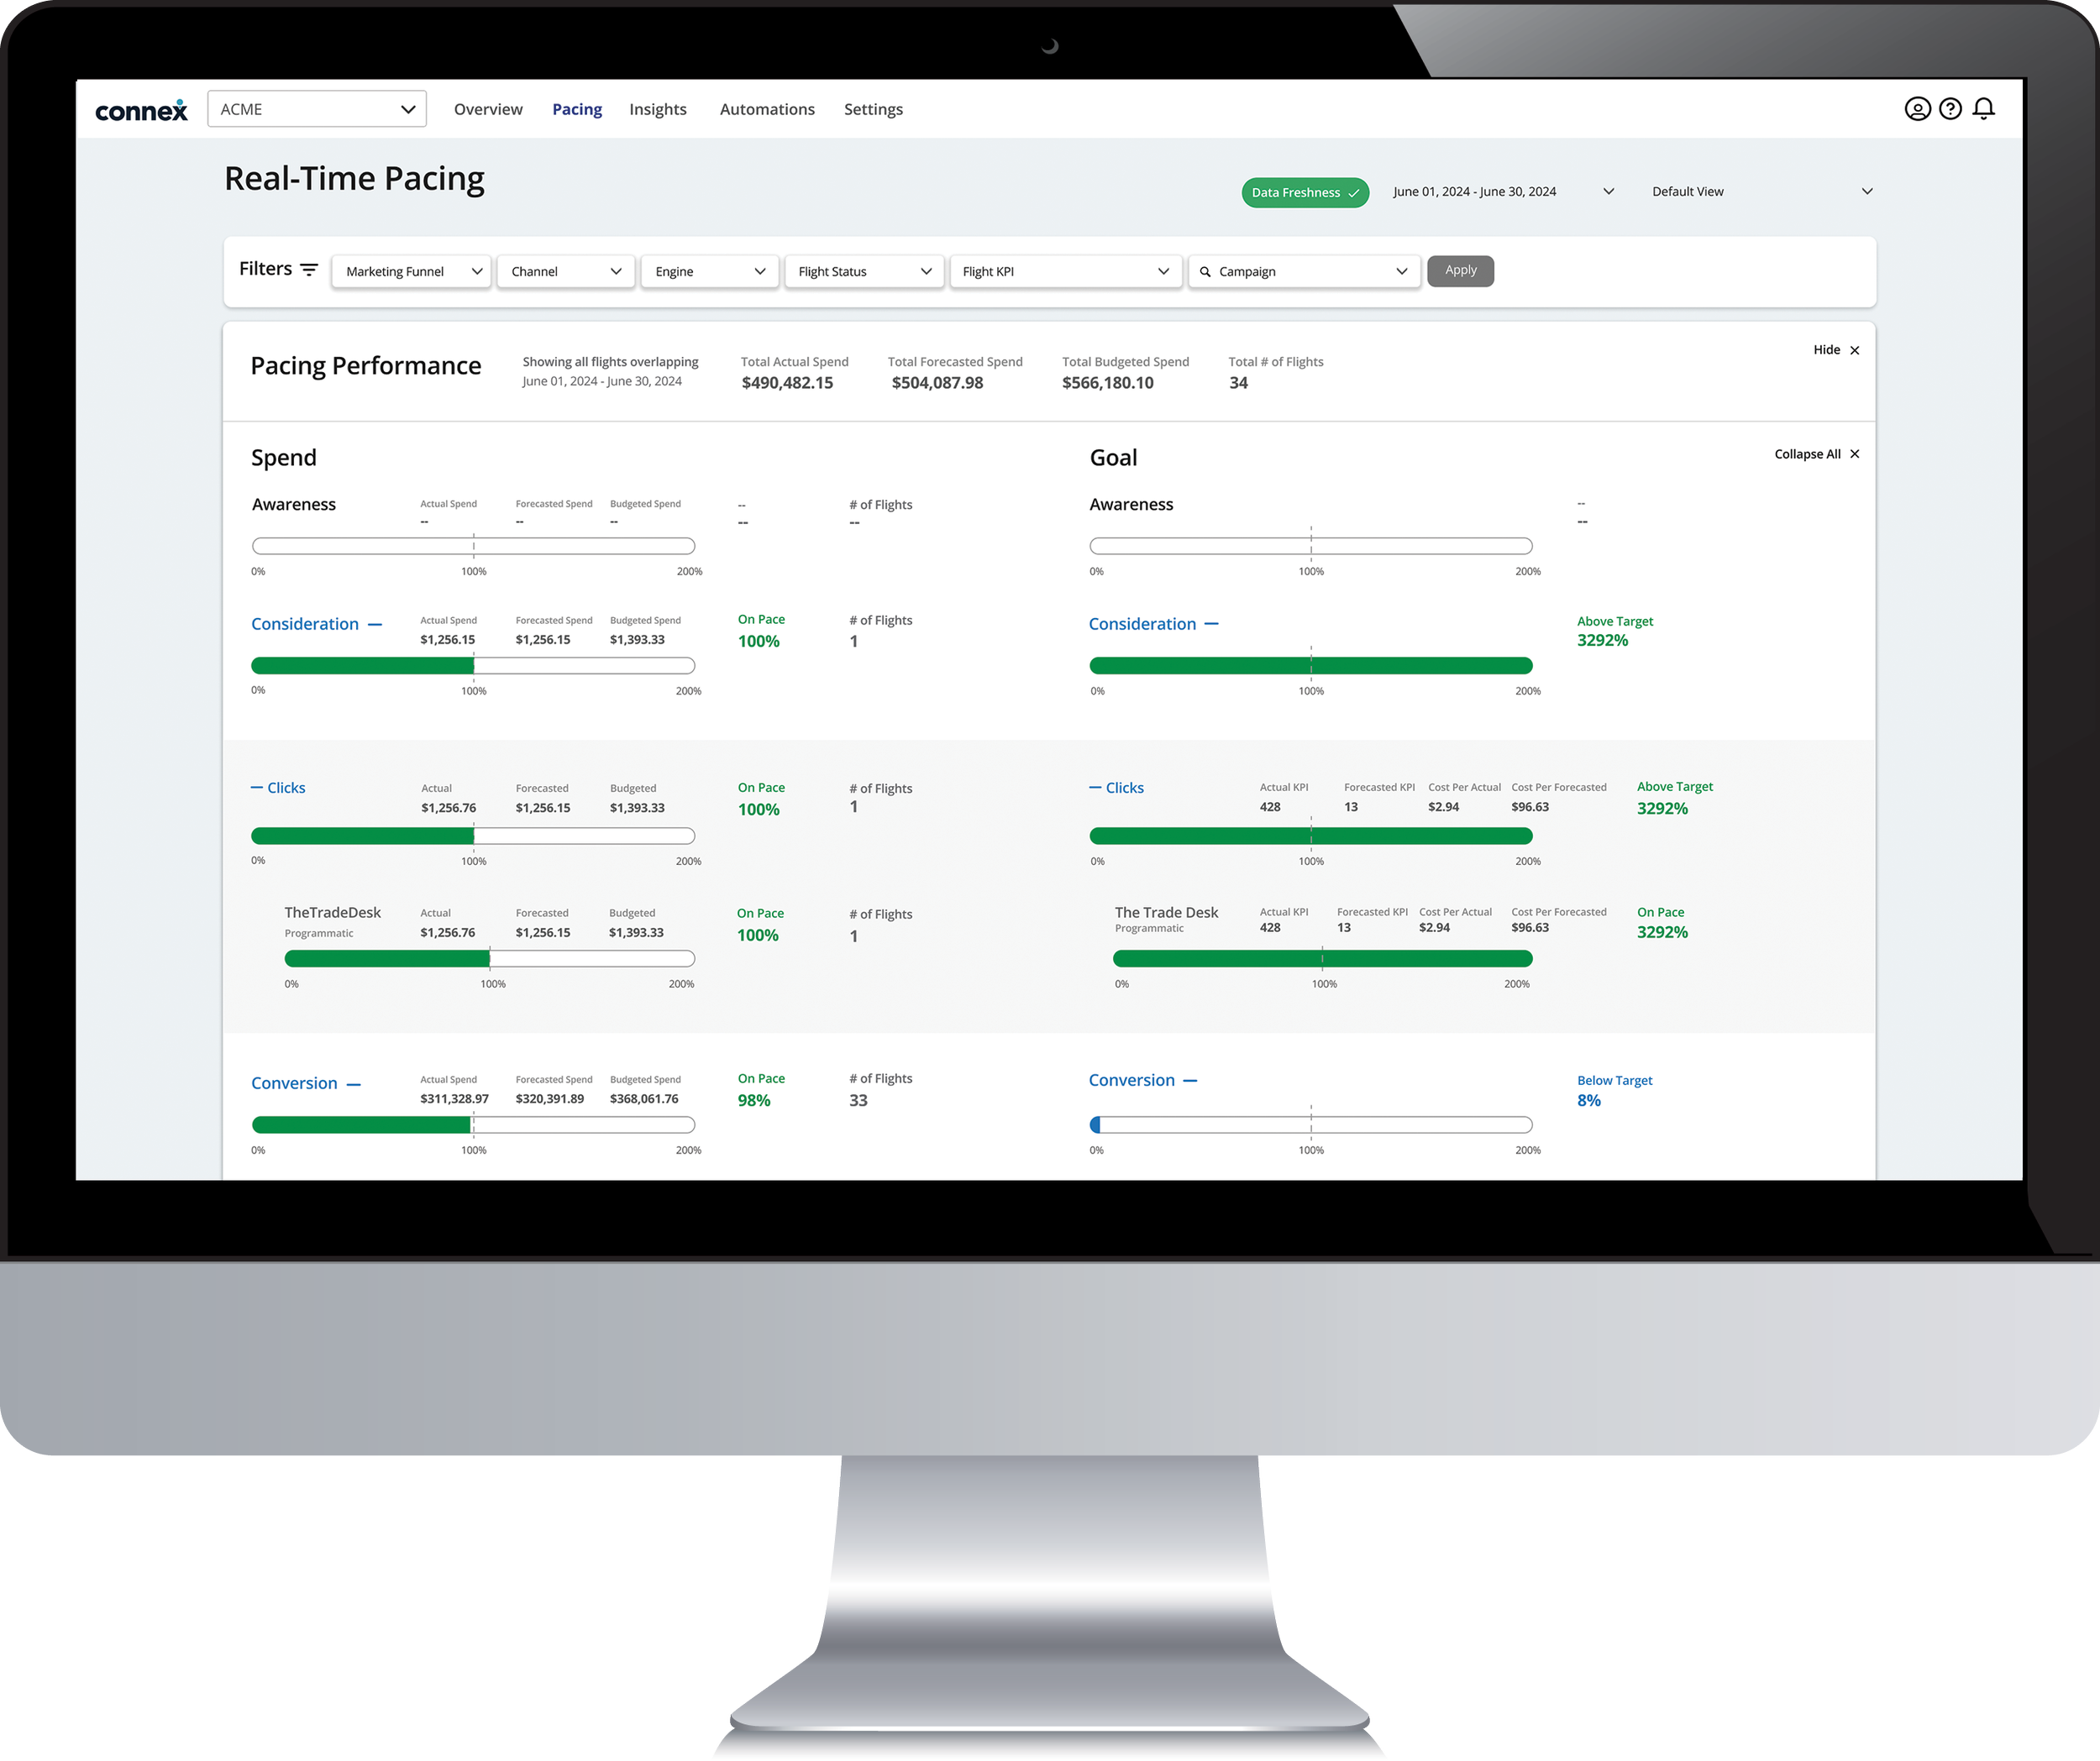
Real-Time Pacing Before
The goal of this page is to show flight pacing performance across all engines and channels. Marketers were having a tough time using this page to help them make actionable decisions for a client budget, because there was so much data to sort through. The page isn’t very engaging, and users would grab data from here and bring it to excel sheets to adjust the data to better tell a story.
With Connex, we wanted to help our marketers answer these questions:
“How can we convince the client to increase our budget?”
“There’s spend pacing, and there is goal pacing. We want to have more conversations with clients about the amount of value we are driving- we want to prove that we are making an impact for clients.”
“Where can we move budget to best increase our client’s ROI?”
“I want to better understand our pacing performance across engines and client KPIs”
Solutions:
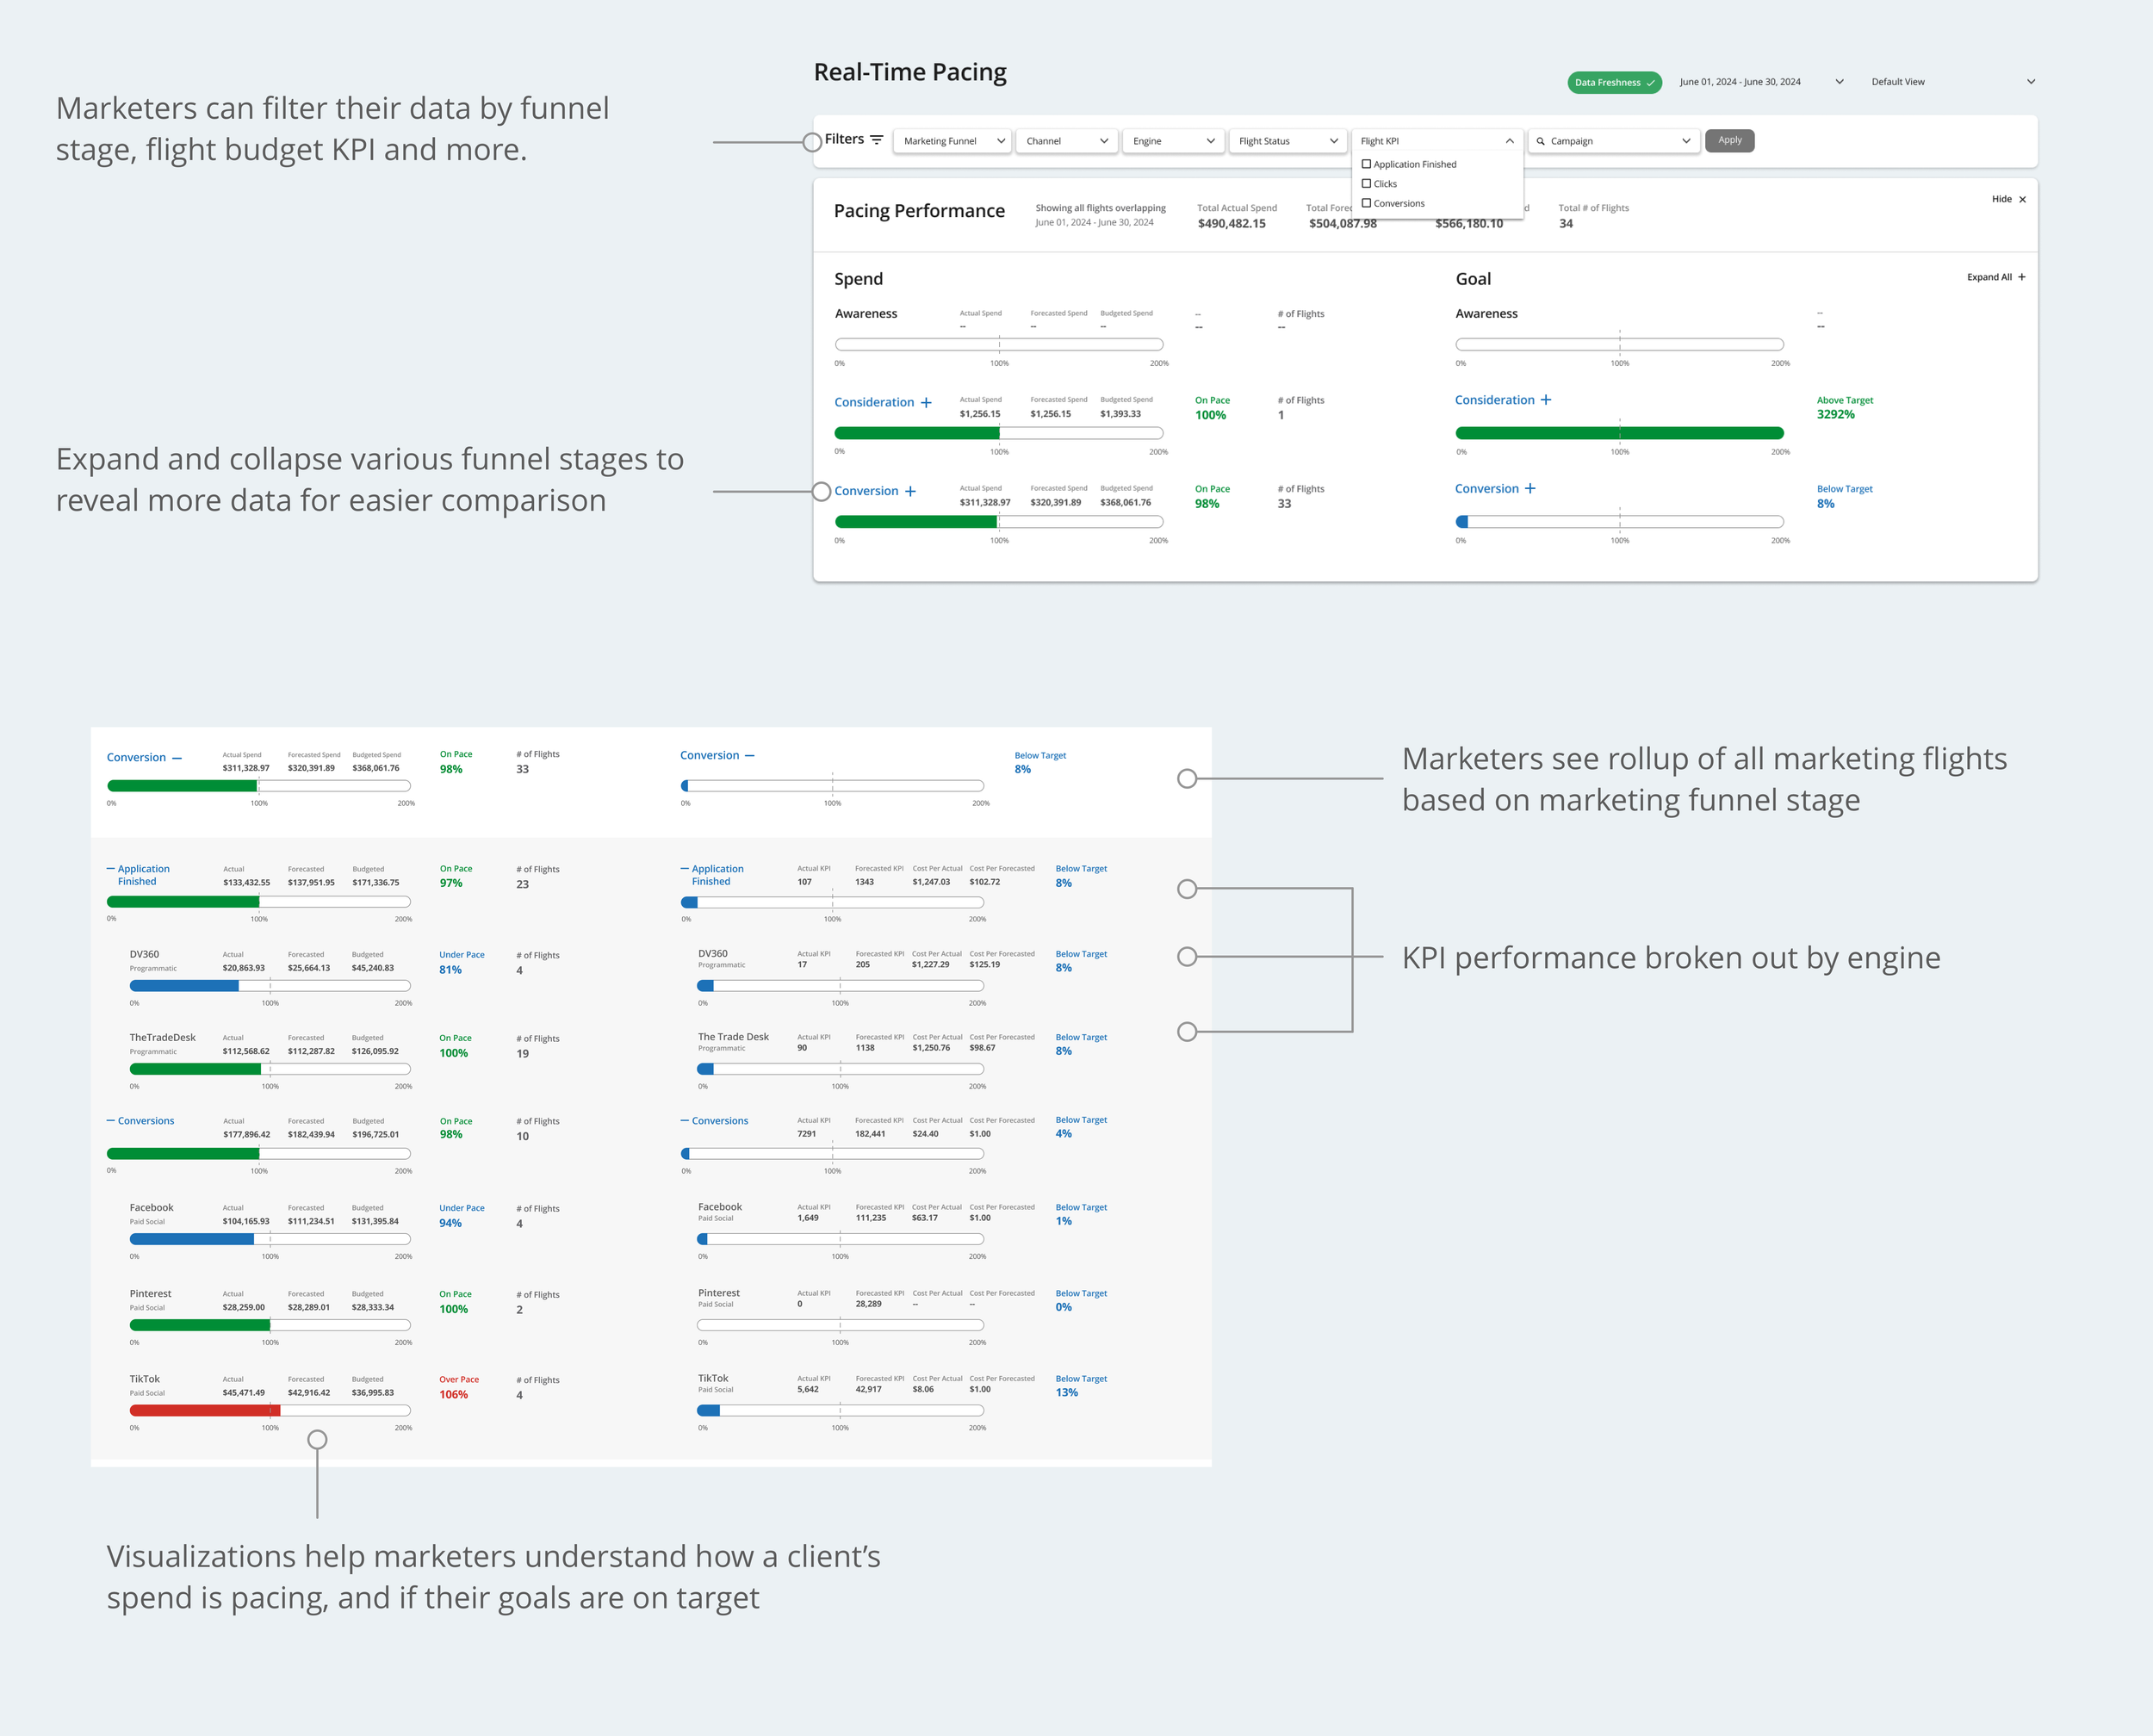
Create new visualizations to show overview and detailed breakdowns of pacing performance
Quickly allow users to filter down results to compare and contrast performance data from multiple sources
Make visuals channel agnostic, focusing more on performance in different stages of the client’s marketing funnel
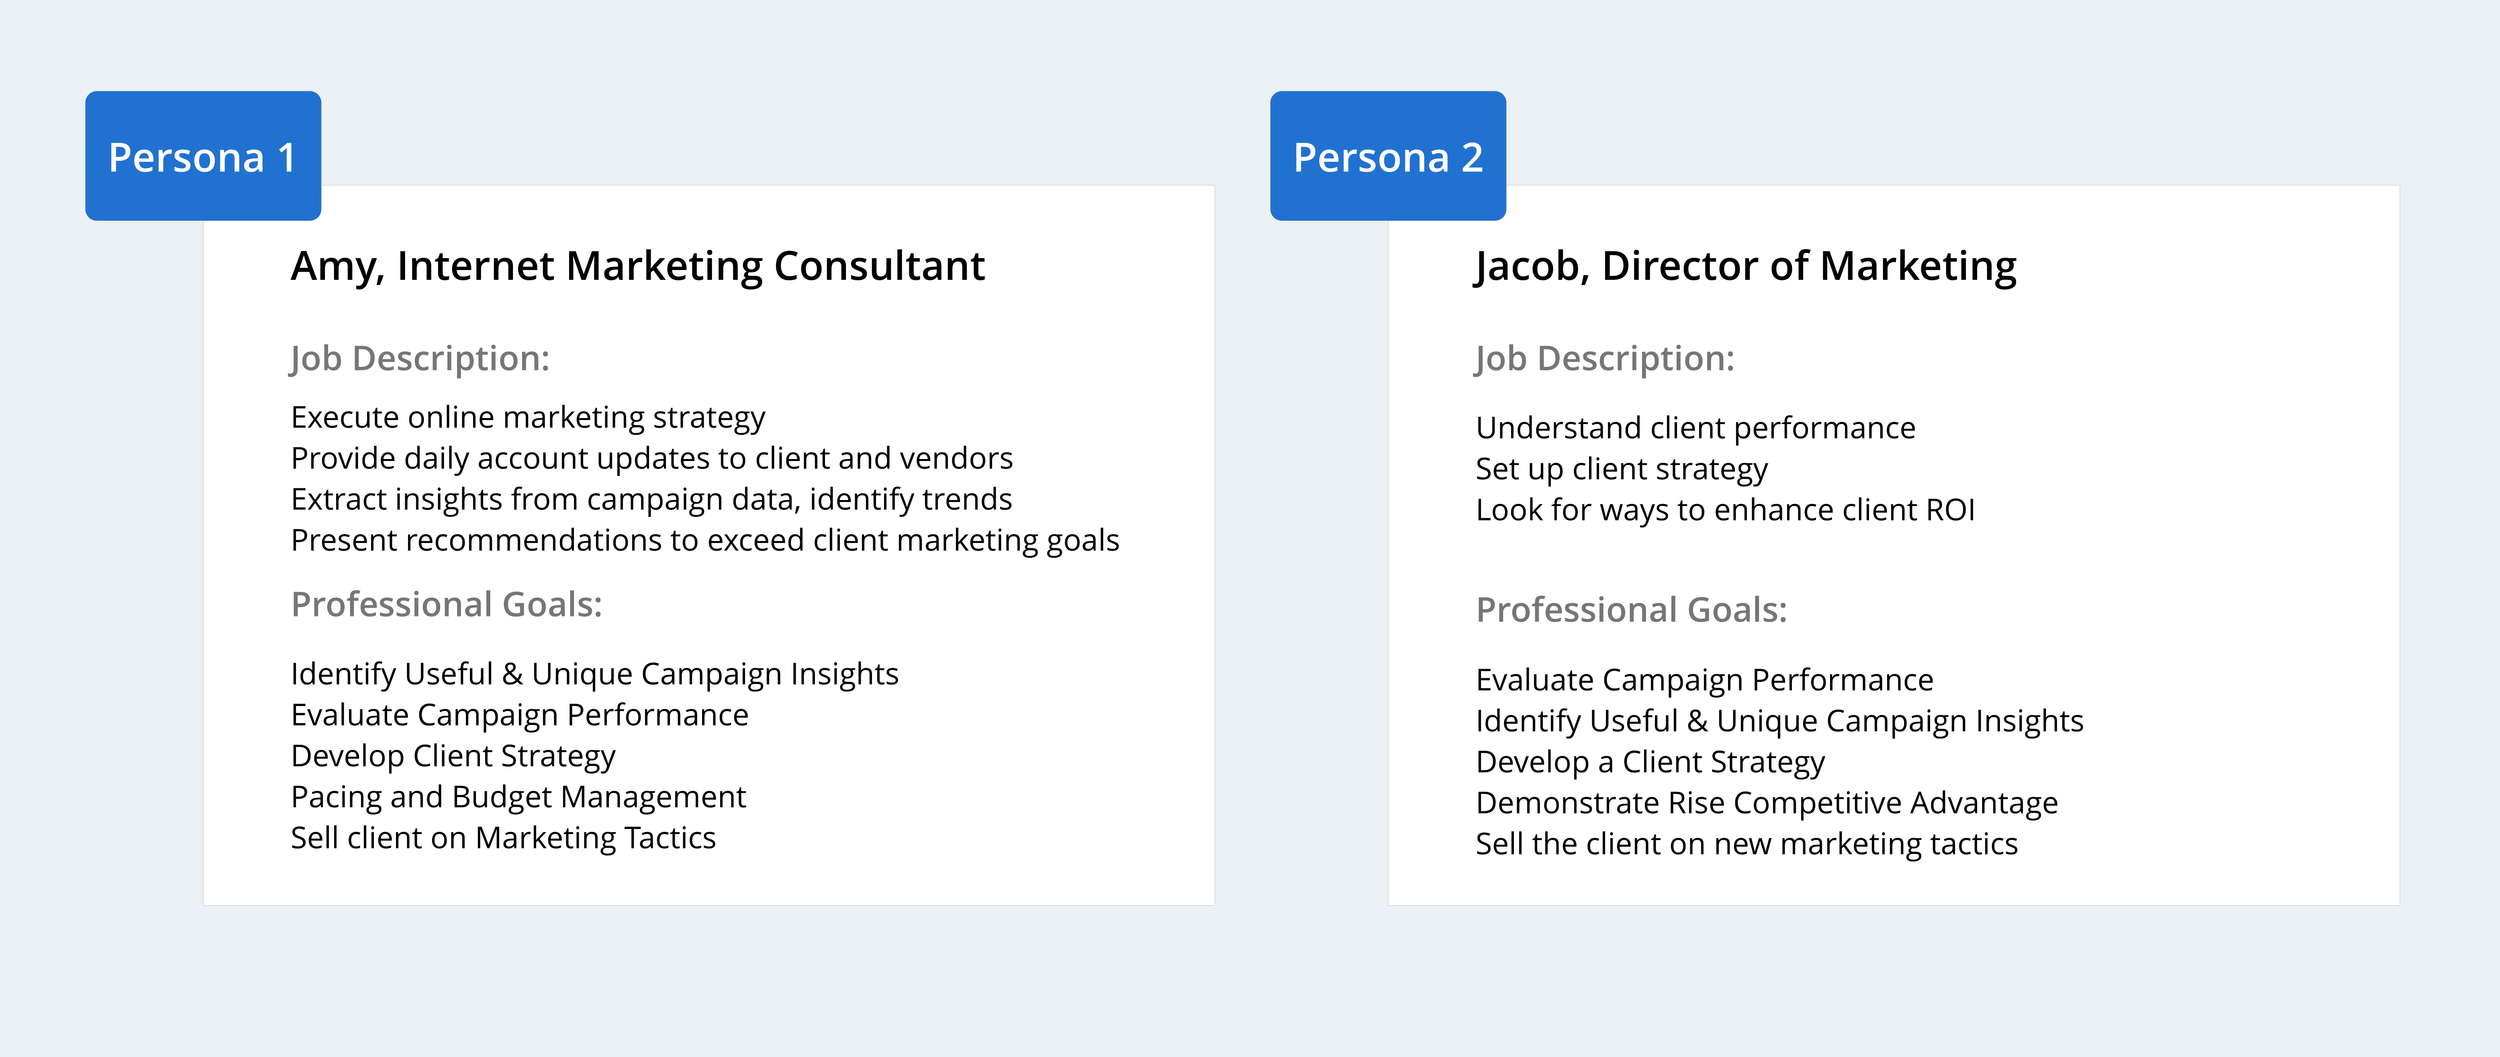
User Personas
We sat with marketers to better understand their needs, what their day-to-day looks like, and how Connex could help them achieve their goals.
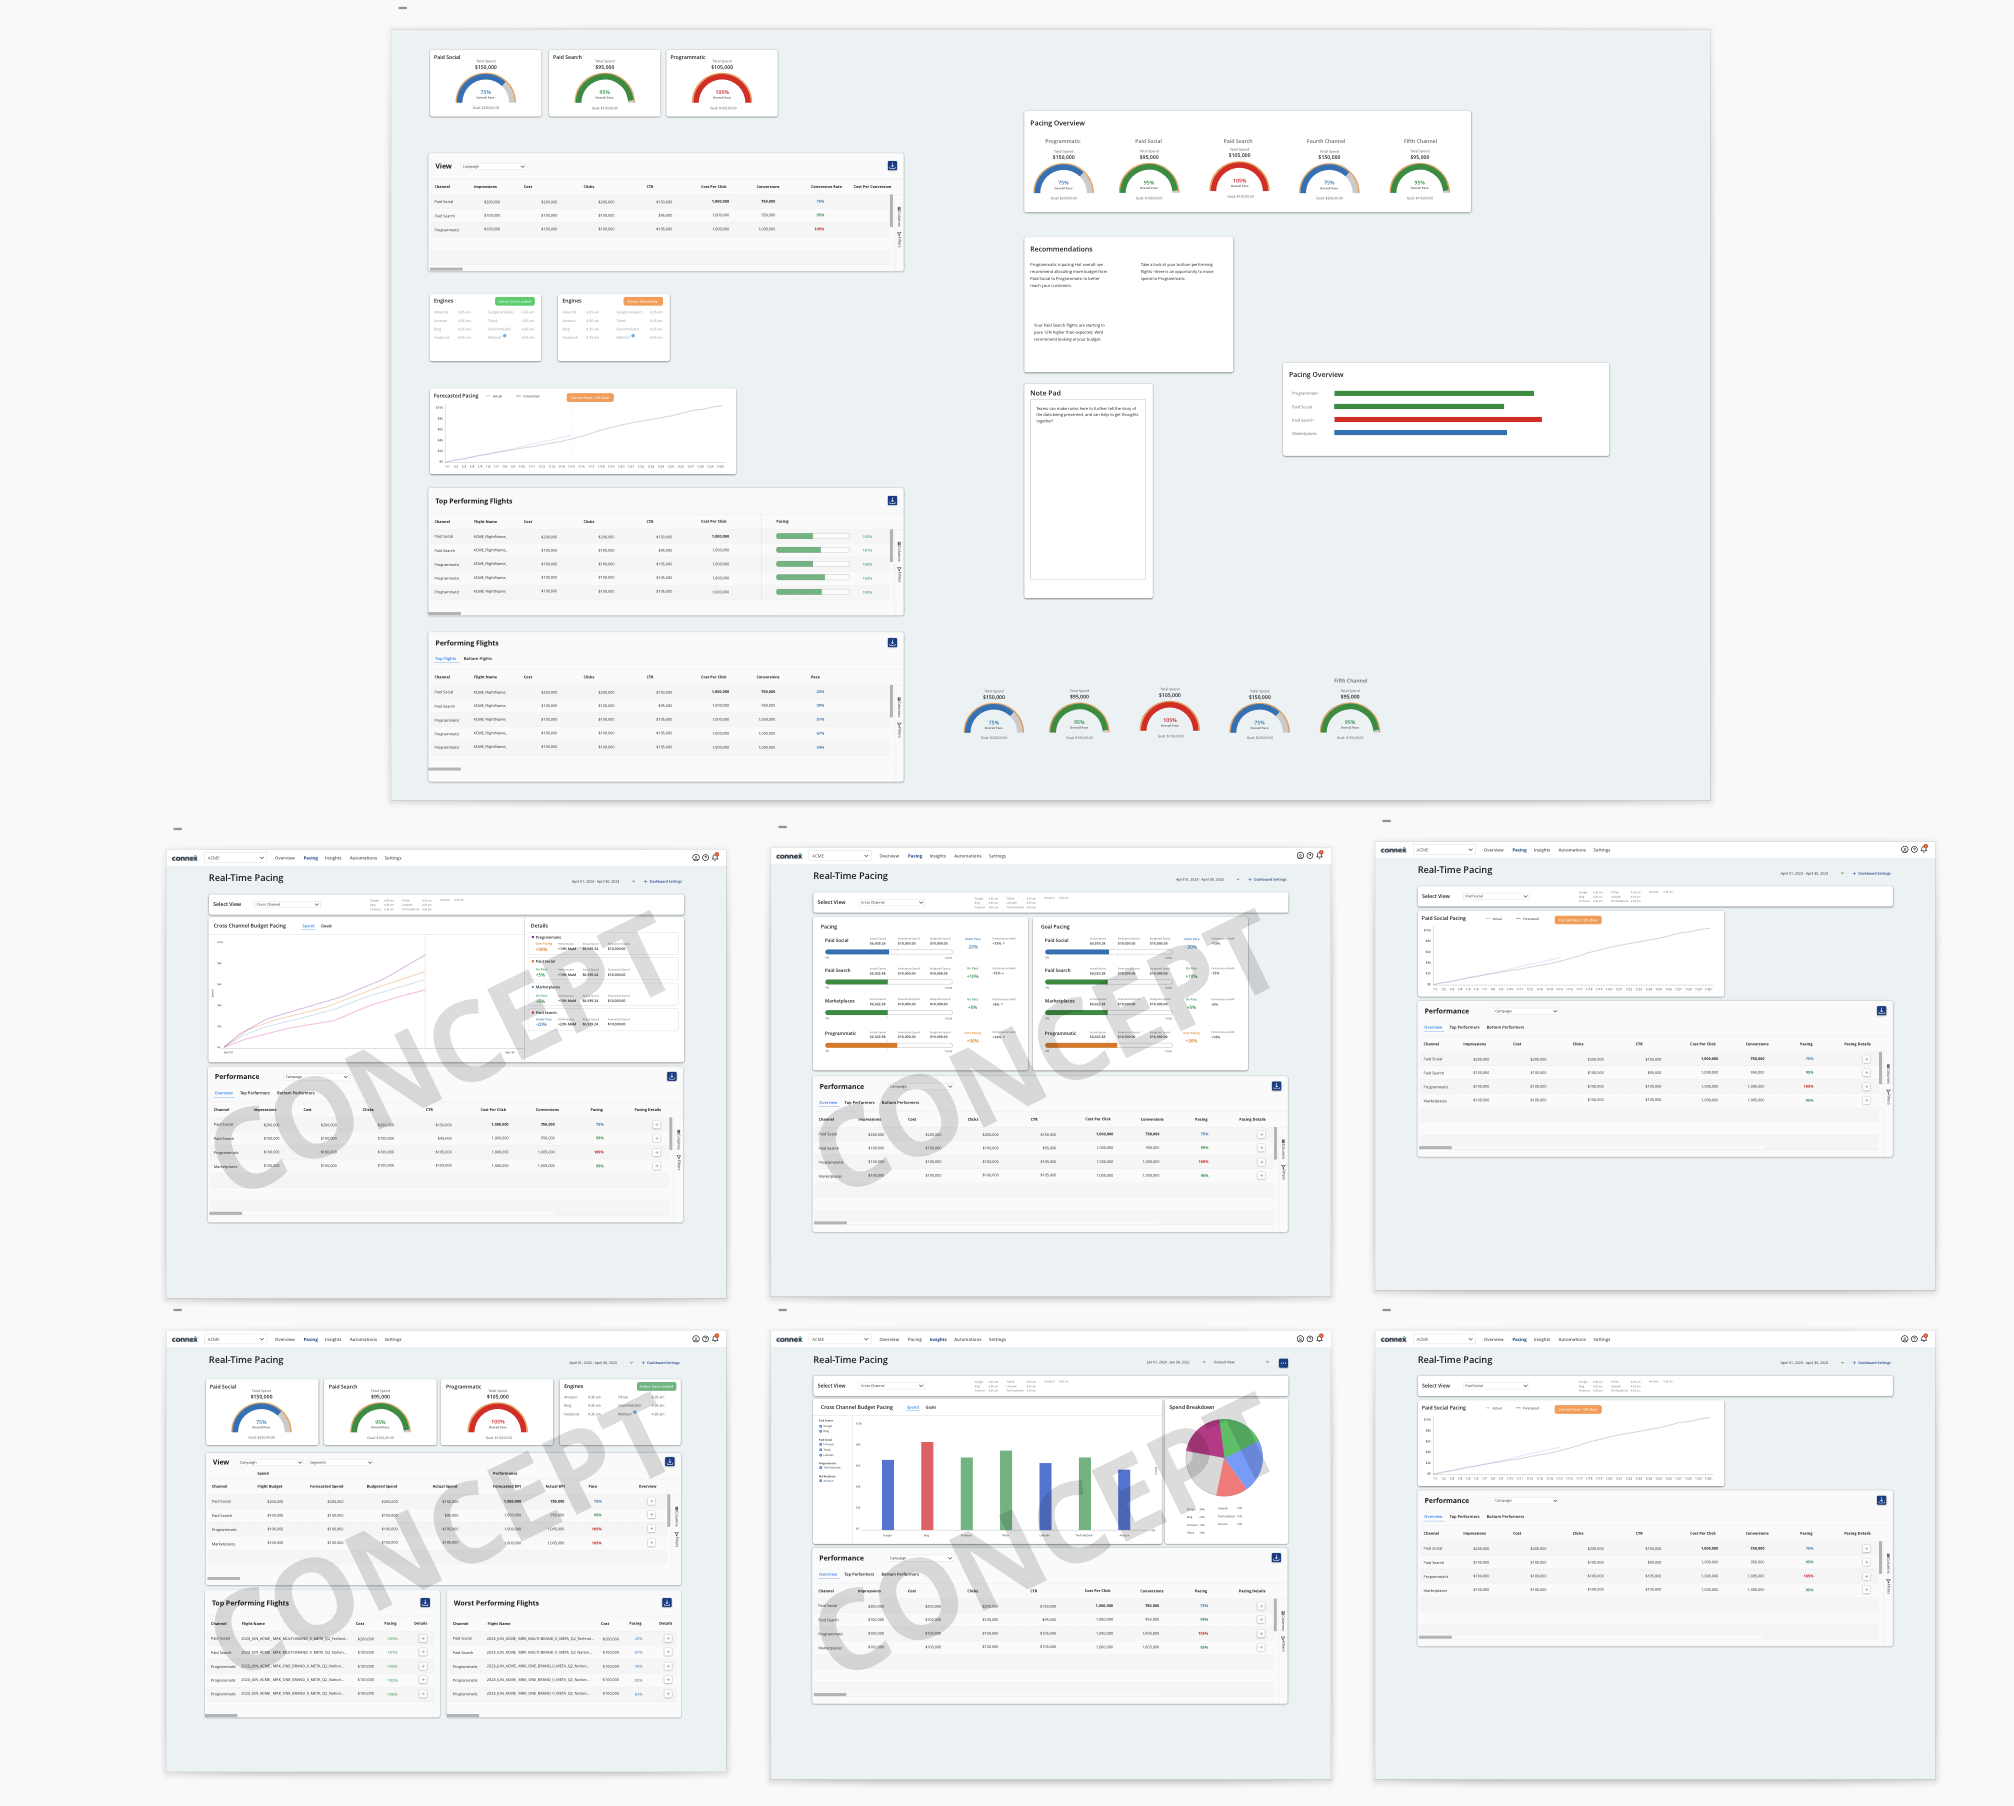
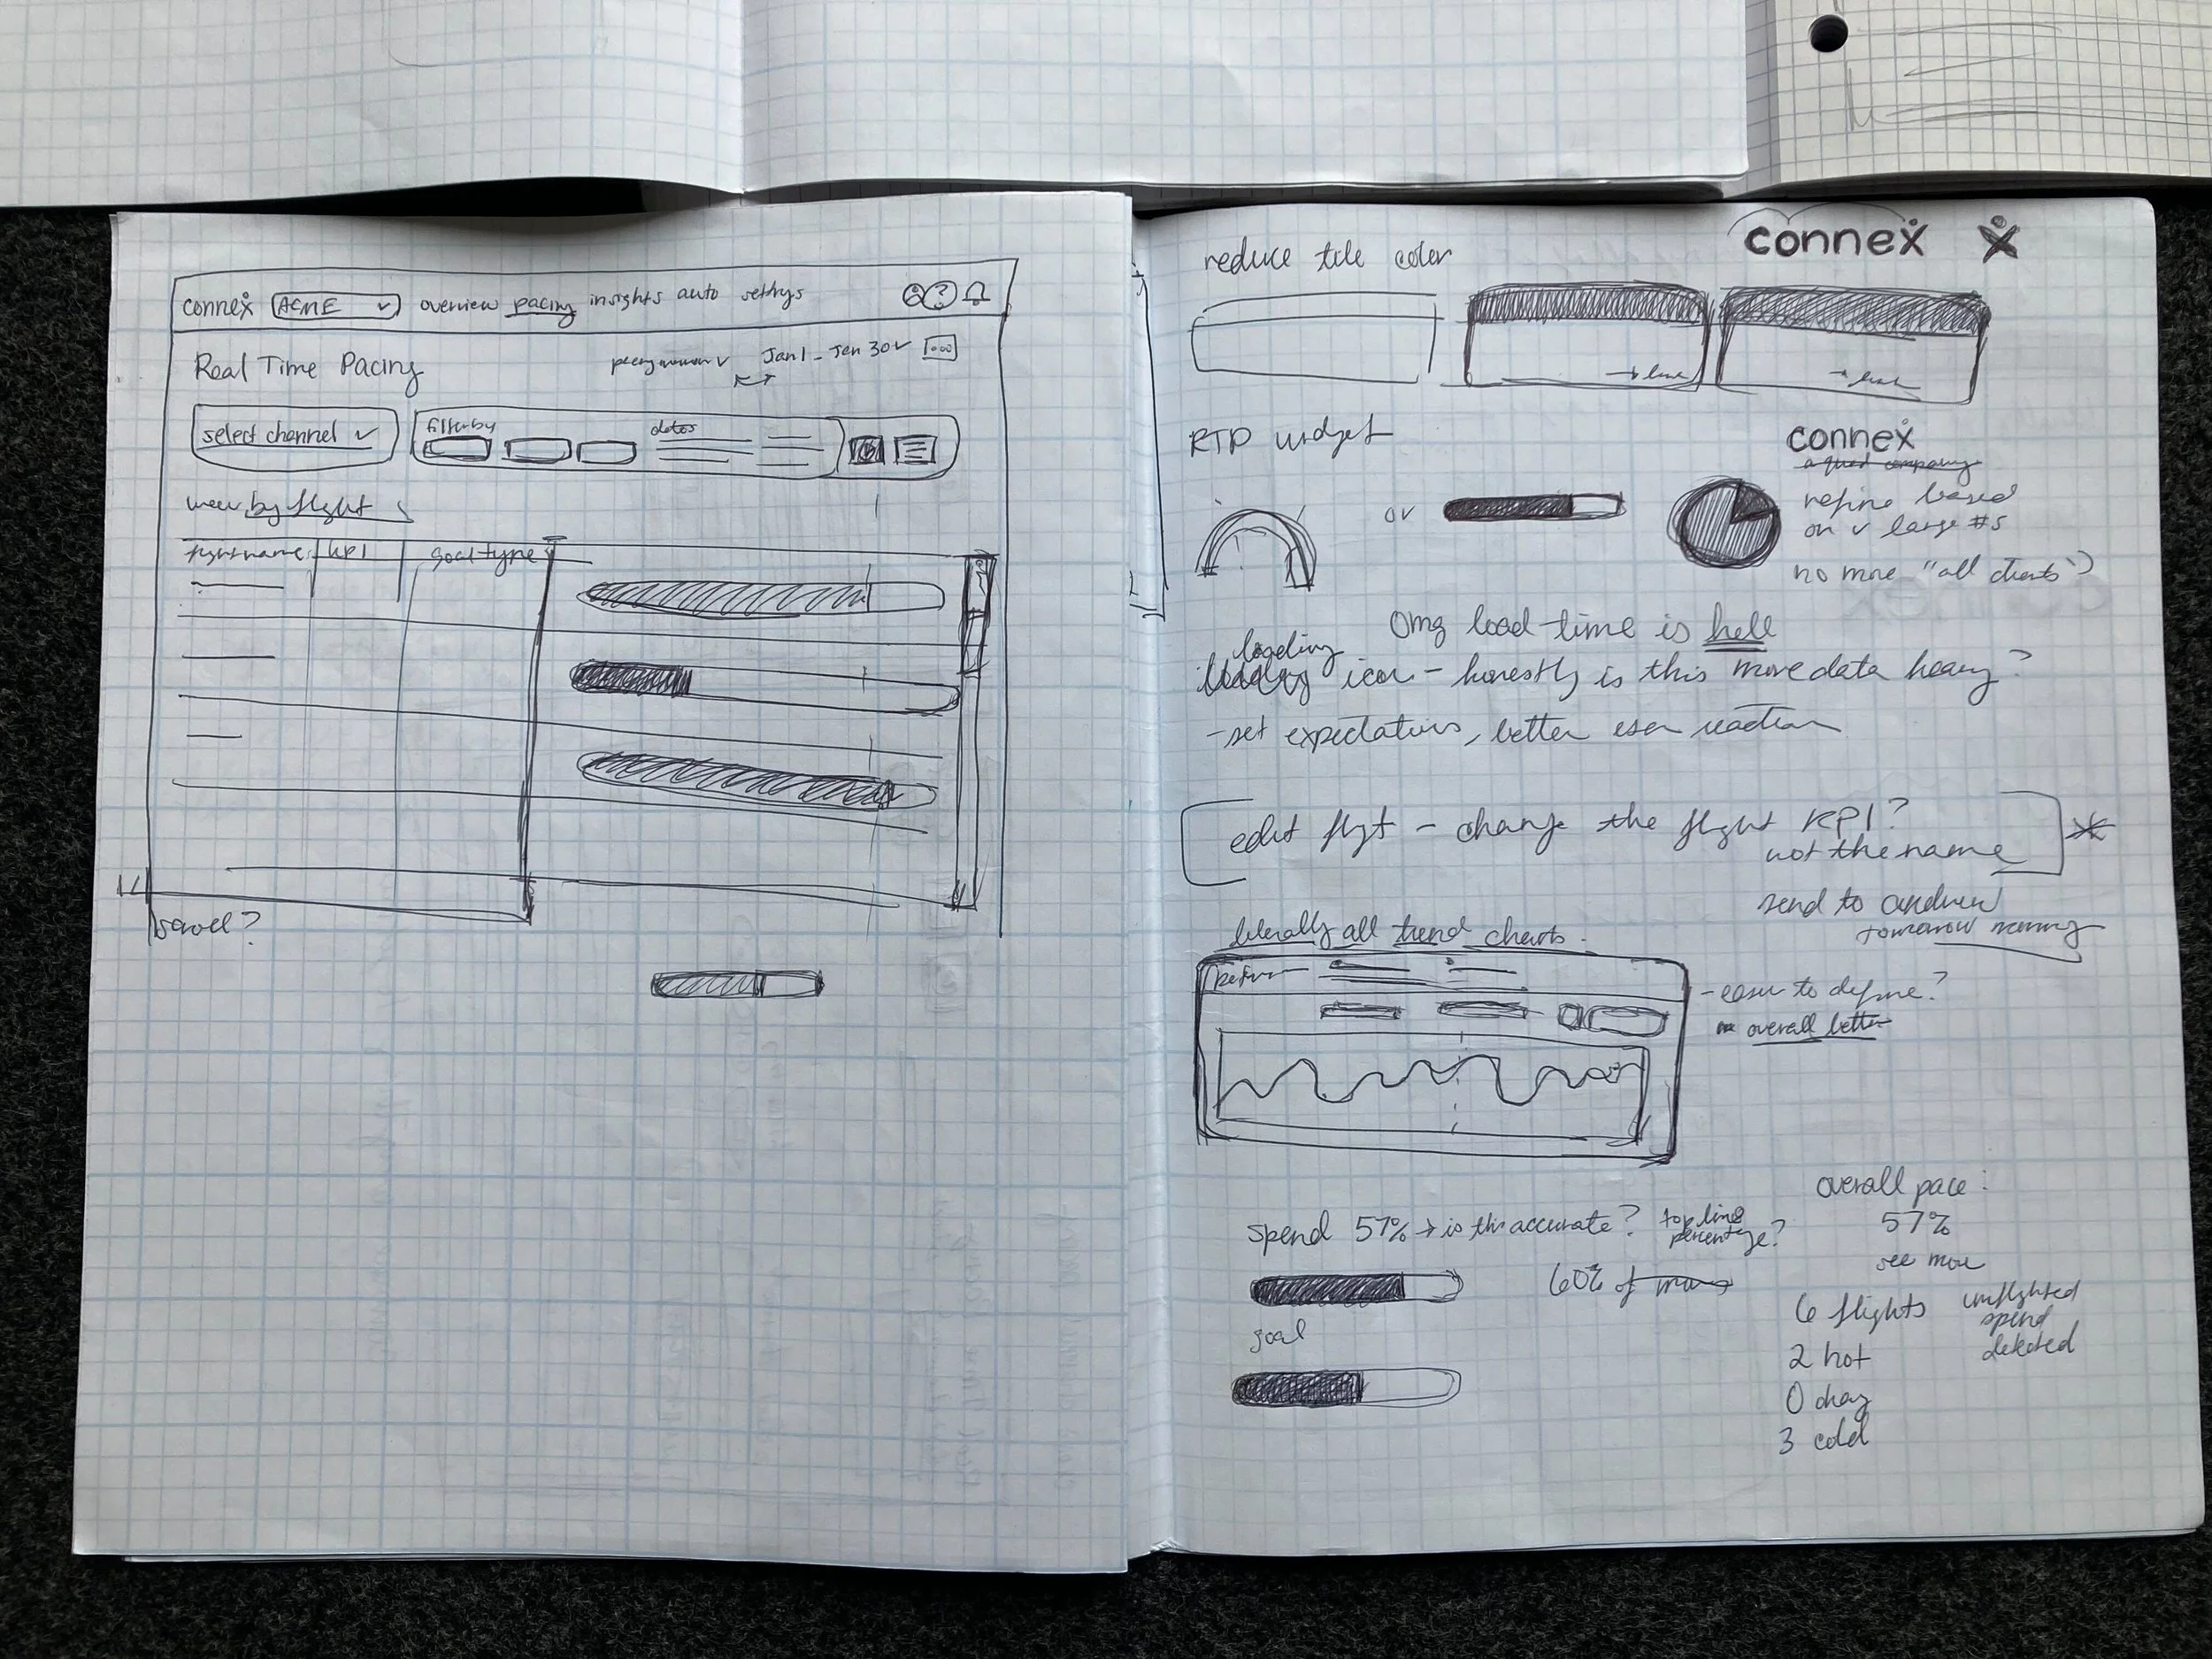
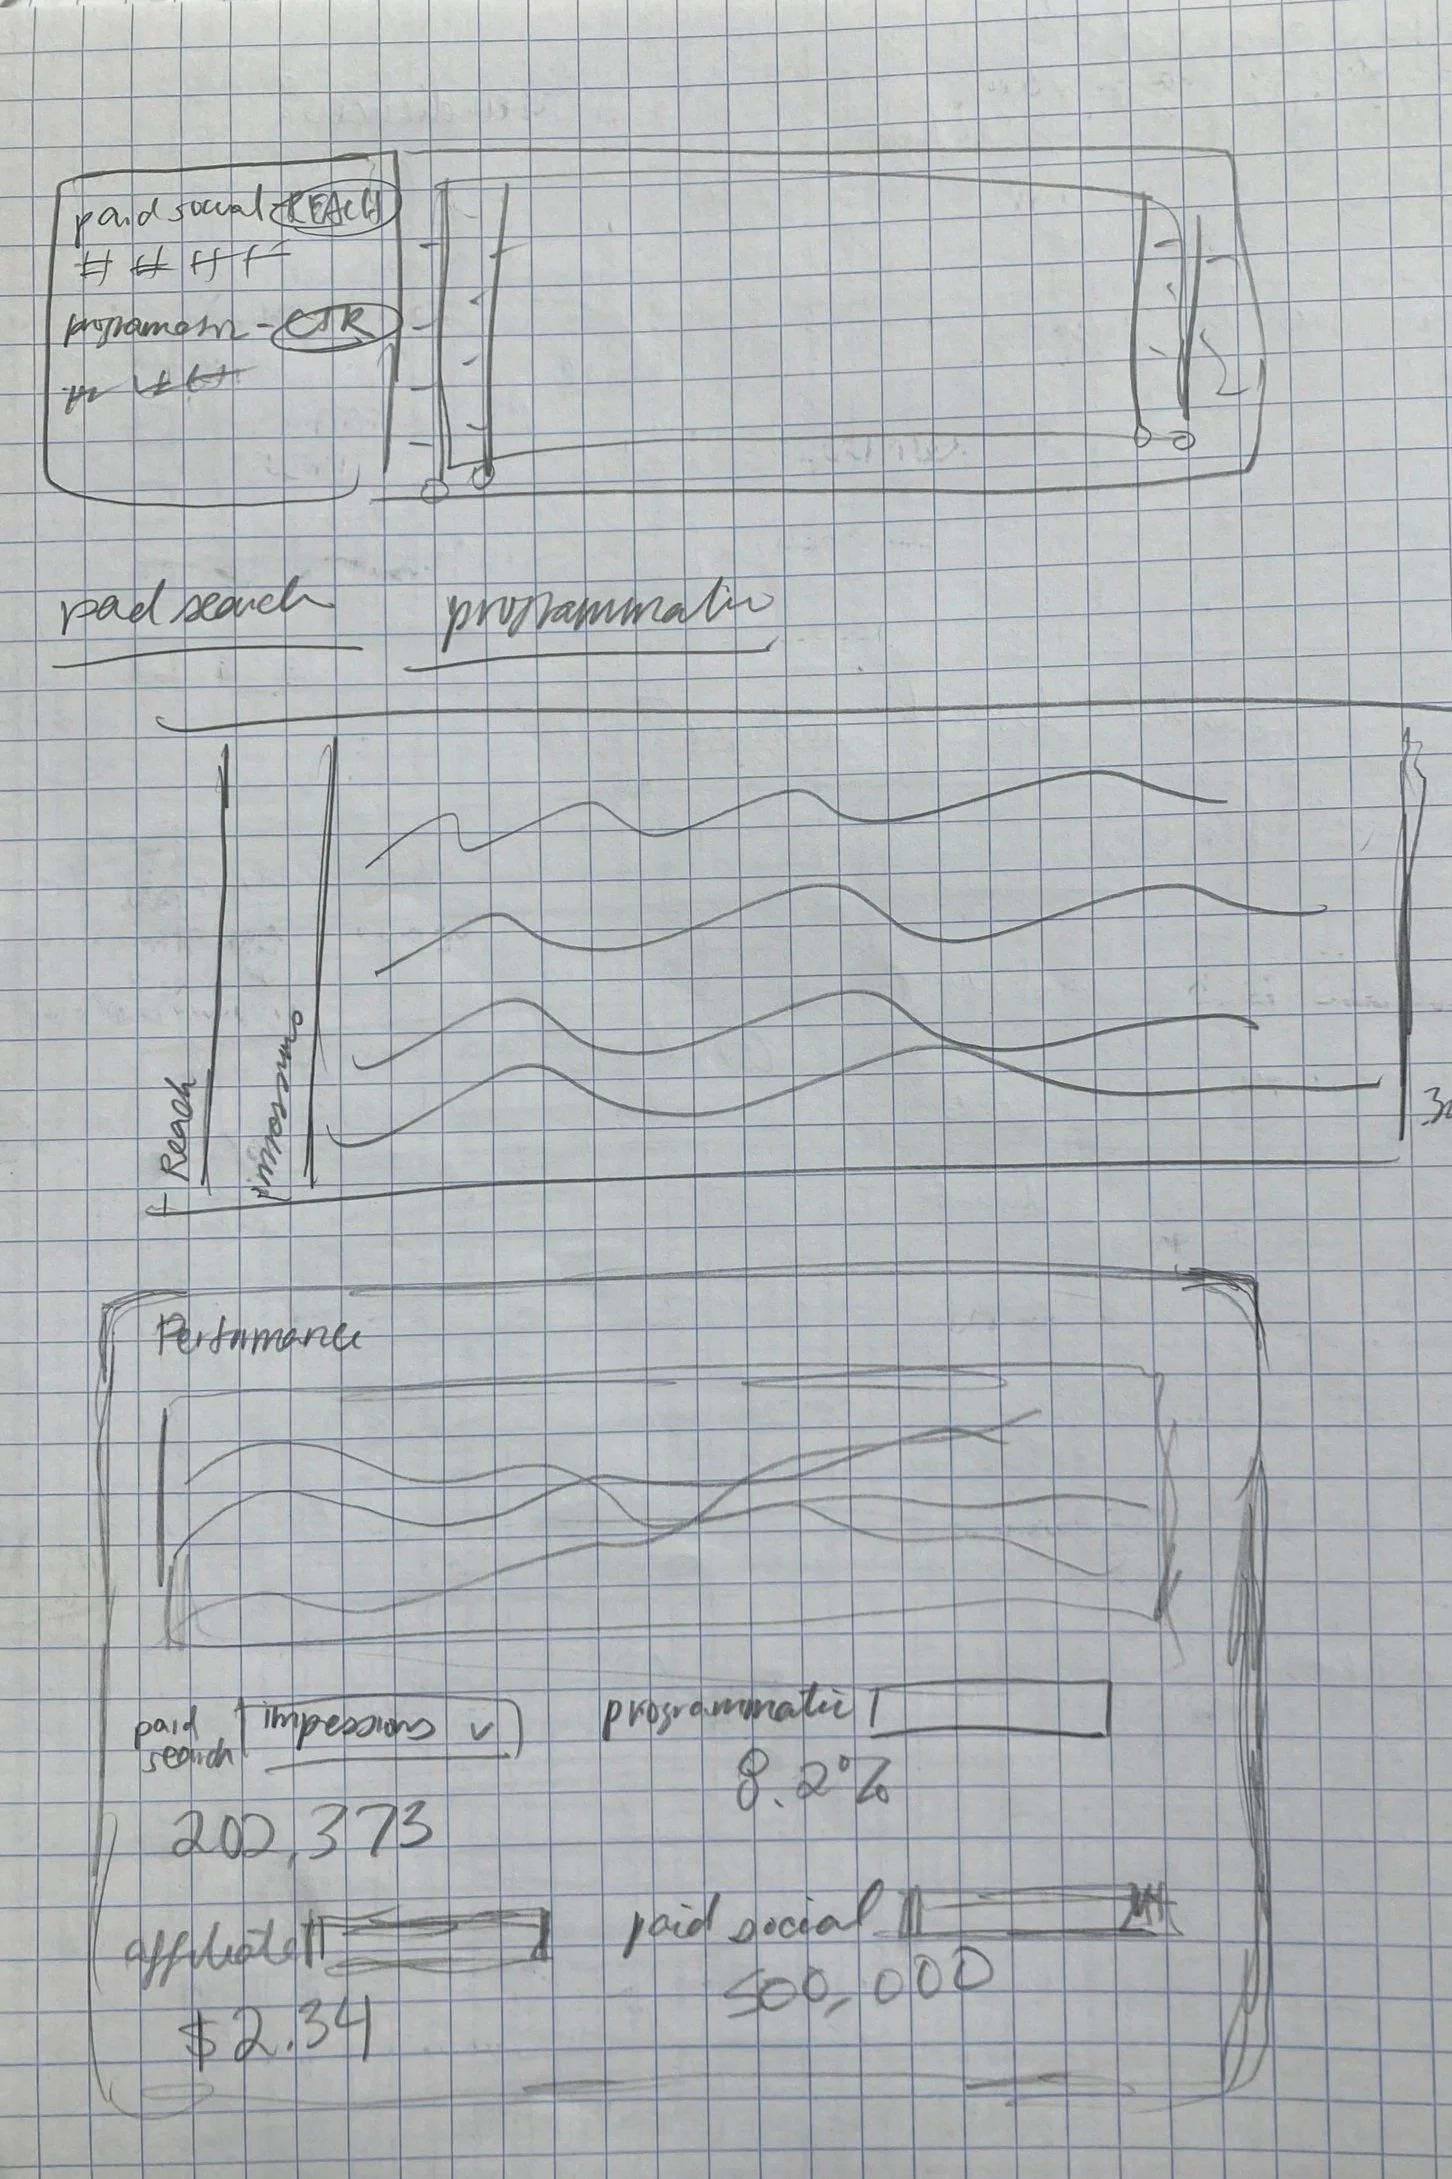
Initial Sketches, Digital Concepts
The Cross Channel Pacing Initiative was the first Connex project that was UX-led. Sketches and early digital concepts were reviewed with digital strategy teams, account management and product teams to assess and determine user needs and wants. The biggest hurdle was determining what visualizations would provide the most amount of value and clarity to help tell a story to our clients.
User Interviews
I led UX feedback sessions and reviewed potential concepts with multiple teams within the company. After a few rounds of user feedback, we asked questions about what they/their clients were looking to see in Connex to help them make easier budget decisions. Users told us that
Our focus for design needed to be less on displaying performance by marketing channels, but instead view performance by stages of the marketing funnel. Channel didn’t matter as much to them- but knowing how awareness campaigns were performing compared to conversion efforts? That could drive significant impact.
Our visualizations are too high level- though they like seeing performance at a high level, they wanted to be able to compare KPIs at the engine level as well (ex: how many impressions are we getting on Facebook compared to Snapchat?)
This feedback helped pivot our focus to work on both granular and high-level visualizations, and completely changed our mindset as to how our marketers were looking at budgets and strategy.
Digital Mocks
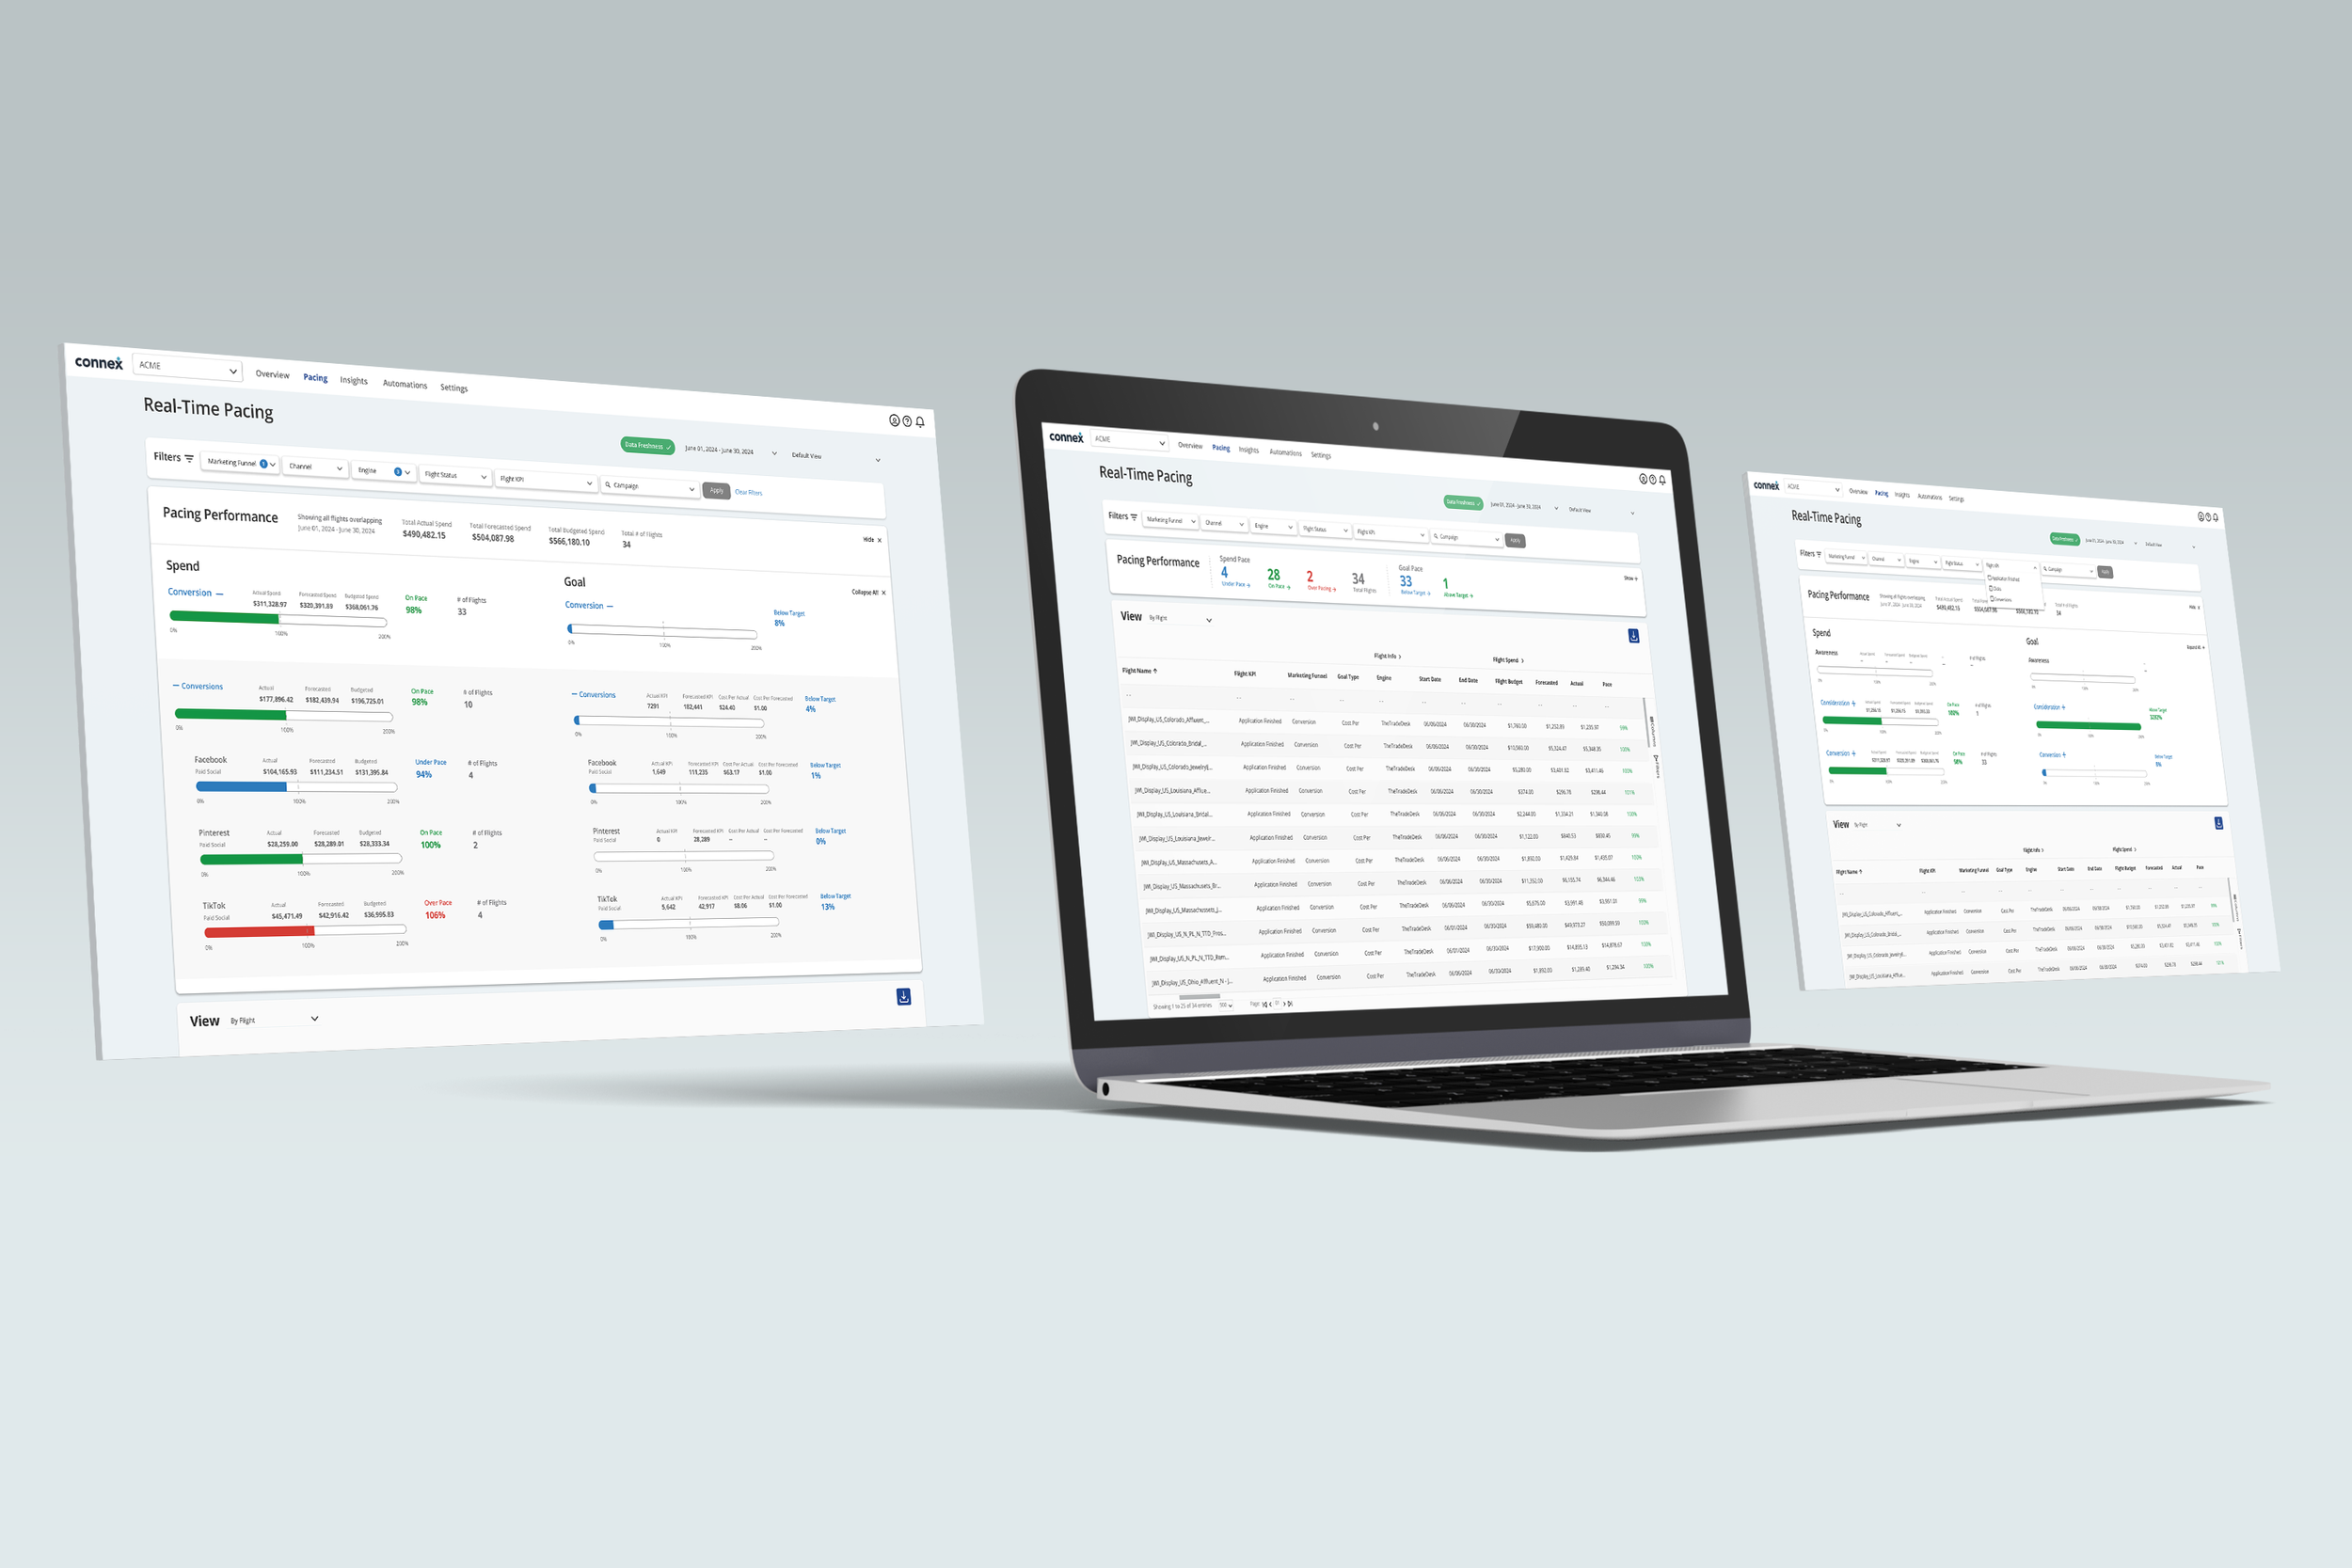
View Performance by Marketing Funnel Stage
Users are able to view all of their marketing flights in a single visualization, with the option to click into various stages of the marketing funnel to get more details on flight performance. Users could track spend pacing and goal pacing performance, which helps them better understand where strategies need to pivot.
Details
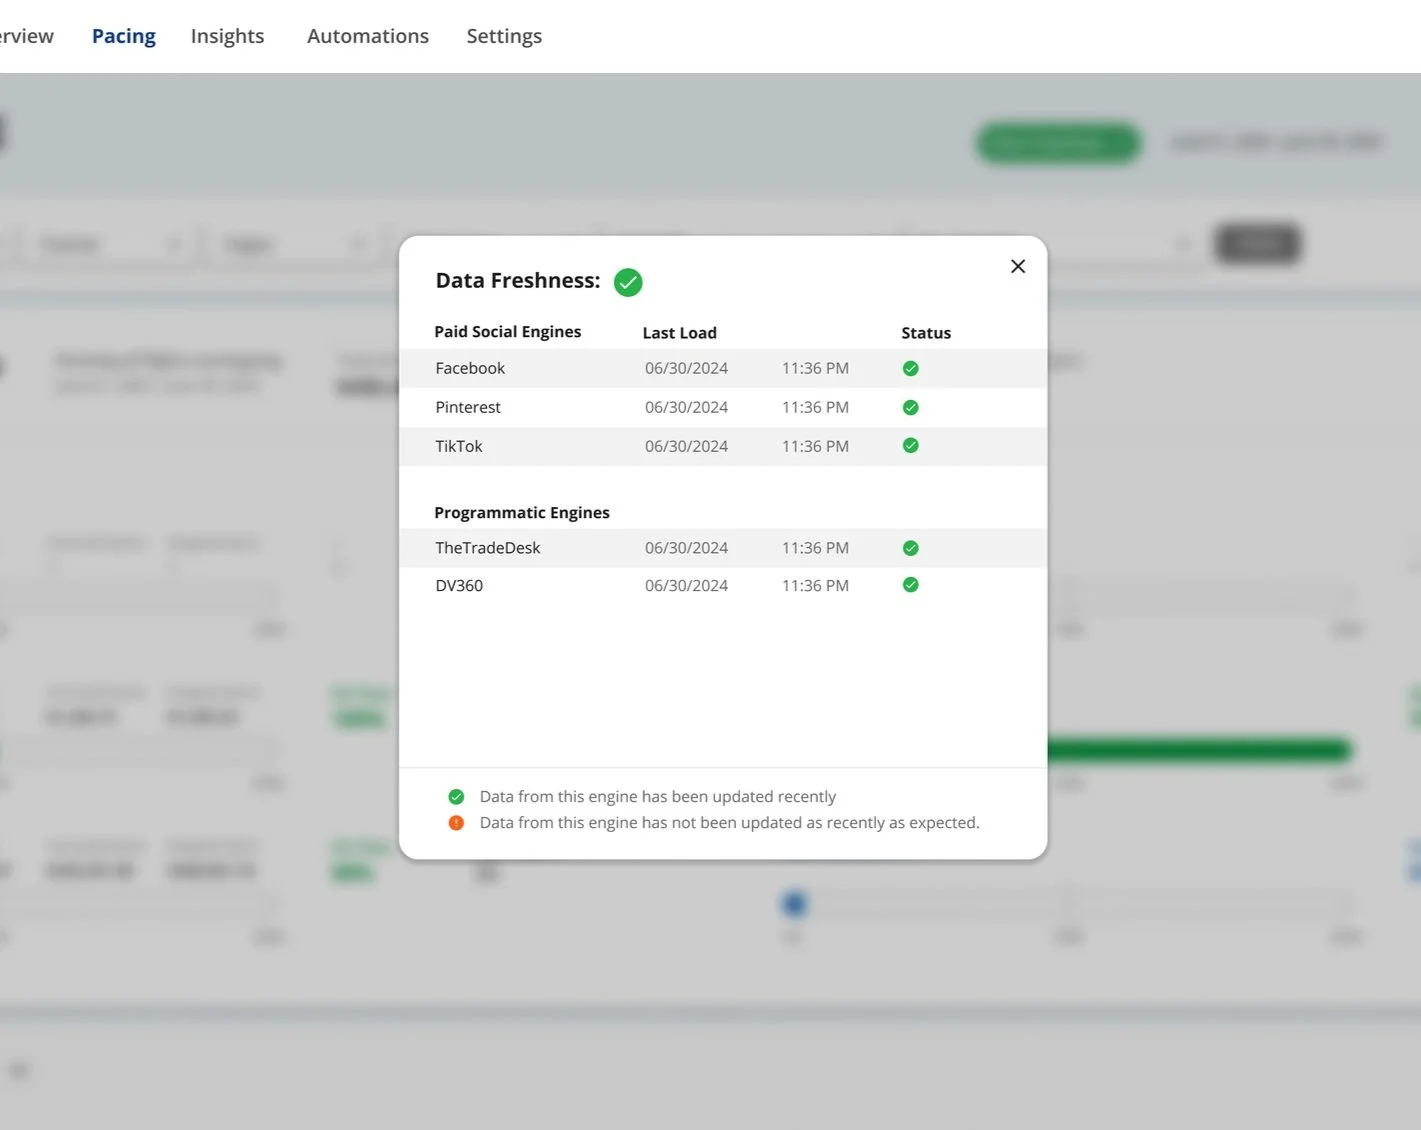
Data Freshness Modal
Marketers are always looking towards the source of truth for their data. The data status modal to allow users to see when the most recent data was loaded into Connex. This helped us to establish trust with our users.
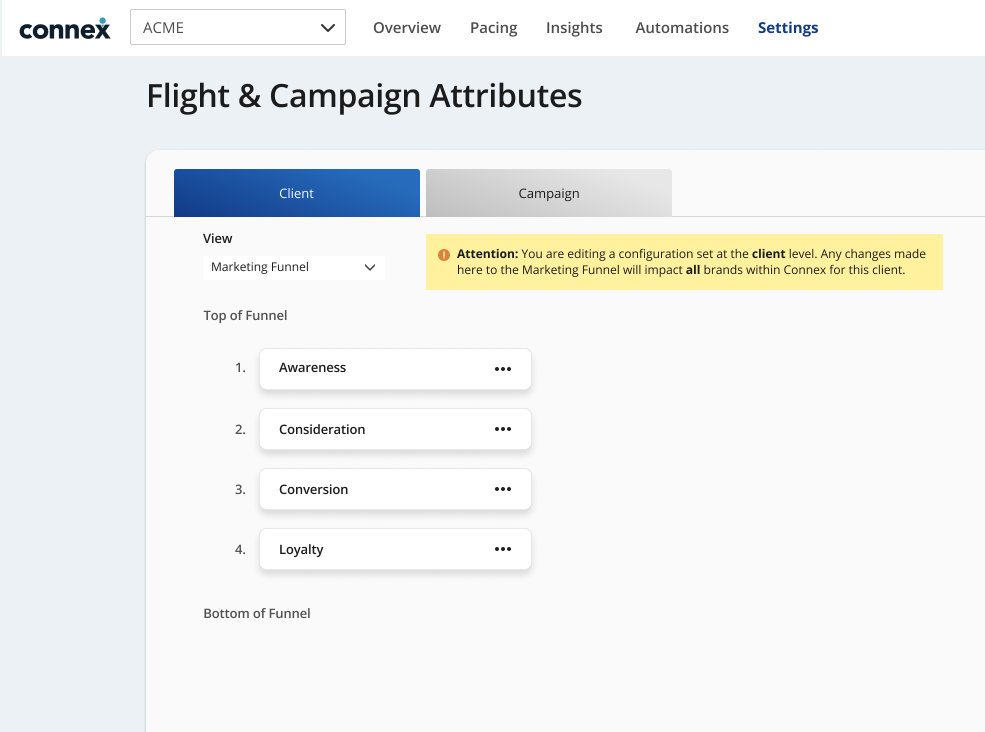
Customize Each Client’s Marketing Funnel Stages
Not all clients work with the same marketing funnel stages. Marketers can specifically customize their client’s funnel stages in Connex for easy attribution.
Results
This research and project was a major pivot in the Rise organization. Swapping from channel-focused views to a marketing funnel comparison perspective allows for much smoother conversations with our clients. Hear what our users have to say:
“It’s exciting to see how much easier it will be to compare data- I haven’t seen anything quite like this.”
“WHOA, this is a game changer. I love that I have insights into multiple levels of data.”
“The updates to Real-Time Pacing are awesome- not only can we talk about spend pacing performance, but we can finally have effective conversations about goal pacing too. We had trouble doing it before.”

